Structured data on building performance

Problem Addressed
The energy required to heat, cool, and power our buildings is responsible for 19% of the UK’s carbon footprint. To make informed decisions about how we can best reduce a building’s operational emissions, we need better and more comprehensive data about its current performance. Currently, building data is often inconsistent, incomplete, or difficult to access, making it hard for building owners to improve the operational performance of their buildings.
Case Study
Prologis
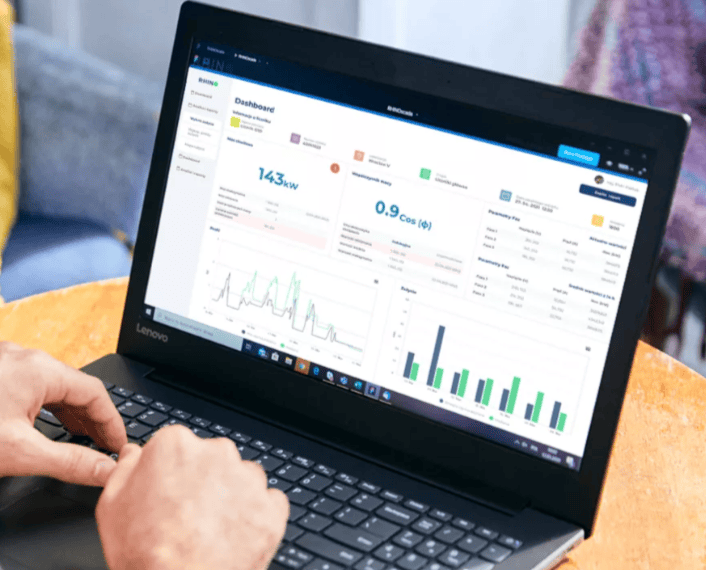
Prologis, a provider of distribution facilities, have more than 2,600 smart meters installed in 161 warehouses. With Rhino, Prologis can automate tenant billing and compare utility data with the goal of achieving more energy efficiency.
GLP Worldwide
GLP Worldwide implemented Rhino in their buildings to address their challenges with billing tenants for their utility consumption and monitoring power supply requirements. With Rhino, GLP now has a tool that can help them improve their energy efficiency. Rhino monitors the energy, gas, and water usage in GLP’s buildings with all the information available in a single app. GLP’s tenants can now make sure their heating systems are properly functioning, device energy consumption is as expected, and there are no water leaks. Since using Rhino, GLP has noted an improved quality of their spaces, lower utility consumption, and a reduced carbon footprint.
Facts and Figures
This page presents data, evidence, and solutions that are provided by our partners and members and should therefore not be attributed to UKGBC. While we showcase these solutions for inspiration, to build consensus, and create momentum for climate action, UKGBC does not offer commercial endorsement of individual solutions. If you would like to quote something from this page, or more information, please contact our Communications team at media@ukgbc.org.
Related
Software to measure and report on building performance

Air quality sensing and monitoring

Analysis tool to minimise embodied carbon on buildings

Software tool to analyse building operations

