The Whole Life Carbon Roadmap – Answering your data FAQs received to date


This is the first in a series of three blog posts on the Net Zero Whole Life Carbon Roadmap (the Roadmap). In this post, Alexandra Jonca, Project Officer for the Roadmap and Circular Economy, takes a deep dive into some common technical questions that have emerged about the Roadmap’s data and methodology.
Where does the 25% emissions figure that the UK built environment is responsible for come from? Why is this different from the 40% figure I see commonly mentioned? How else can I leverage the data in the Roadmap to drive the net zero agenda?
These are just a sample of some of the questions that UKGBC frequently receives about the data and underlying methodology within the Net Zero Whole Life Carbon Roadmap (the Roadmap). This blog post seeks to address some of your key questions in one place to help you make sense of the underlying Roadmap data and how it can be leveraged.
One of the Roadmap’s overarching purposes is to serve as a beacon and accountability tool for the built environment industry’s transition to net zero. Achieving this requires us to have a common understanding of what the headline figures mean and how they can relate to other industry goals. Below are answers to some of the questions related to this topic, under three main categories:
- The Percentage of Emissions Generated by the UK Built Environment
- Using the Roadmap Data
- Further work on the Roadmap
The Percentage of Emissions Generated by the UK Built Environment
A common statistic often cited to UKGBC was that the built environment sector is responsible for 40% of UK emissions – why has this dropped to 25%?
The figure now commonly cited from the Roadmap is that the UK built environment is directly responsible for 25% of UK emissions. The previously cited 40% was from a 2016 unpublished paper and included surface transport.
If elements of surface transport were included under the direct control of the built environment, rather than under direct influence, the built environment would instead be responsible for 42% of UK emissions. However, to provide adequate focus to the industry within the constraints of this project, the system boundary includes all embodied and operational carbon in buildings and infrastructure, and excludes emissions related to surface transport and energy distribution.
How does UKGBC derive the 25% emissions total that the UK built environment is responsible for?
The 25% figure is translated from the CCC 6th Carbon Budget and includes emissions under the direct control of the built environment sector, as well as consumption emissions attributable to the sector.
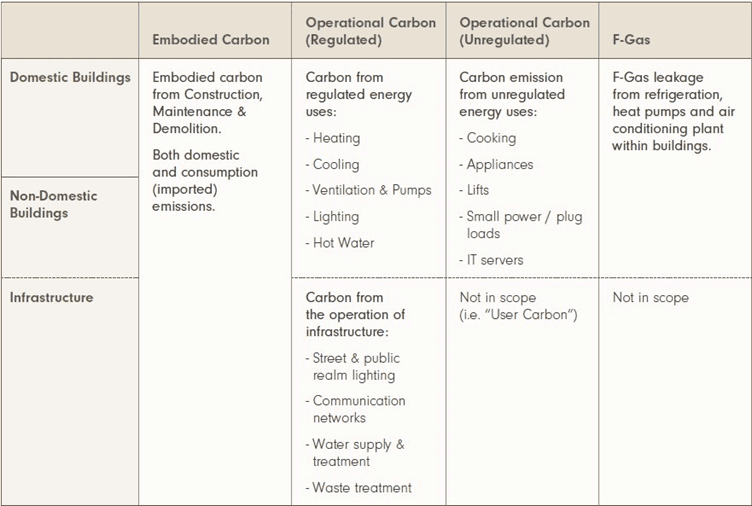
The Climate Change Committee splits UK emissions into various categories or sectors. Emissions related to the UK built environment cut across several of these CCC sectors, most obviously Buildings, but also elements of Manufacturing and Construction, Waste, Surface Transport, F-Gases and others. Furthermore, although a proportion of embodied carbon emissions from construction are captured within UK Manufacturing and Construction, a significant proportion (30-40%) relate to extraterritorial emissions, i.e. construction materials and products produced overseas and imported to the UK. Therefore, to accurately determine a carbon footprint for the UK built environment and identify relevant actions, an appropriate system boundary and sub-sector categories were defined to account for all elements of infrastructure and buildings, including consumption emissions.
The table to the left (Page 16 in the Roadmap Pathway report) displays the Scope of Built Environment emissions.
More detail about the carbon footprint methodology and data sources can be found on pg. 13-14 in the WLC-R Technical Report, which contains more detail on the underlying methodology, data sources, and project process.
Why is UKGBC’s 25% figure different from XY’s total?
This is generally due to differences in scope and how the data divided. One would need to compare both methodologies to determine the exact cause of difference. Some common built environment figures that arise include:
- LETI: “Here in the UK, 49% of annual carbon emissions are attributable to buildings.” LETI’s figure is developed from various sources and covers emissions from businesses (27%) and domestic buildings (22%); road transport and emissions from energy supply are not included.
- WorldGBC: “The built environment is responsible for almost 40% of global carbon emissions.” The exact figure is 37% and from the 2021 Global Status Report for Buildings and Construction, covering emissions from the operational and construction of buildings. This figure covers global carbon emissions, not UK specific emissions.
Ultimately, all of the figures are trying to galvanise action and represent the progress we need to make as sector.
How does the WLC-R align with the new SBTi net zero standard?
The Roadmap effectively sets a science-based target for the UK Built Environment. Within it, the Roadmap makes value judgements about the rate and scale of reductions in different sub-sectors. So, for example, embodied carbon might have a slower rate, and not meet SBTi’s 50% by 2030 rule. But other areas compensate, and as a total, the trajectory should still meet SBTi criteria.
Using the Roadmap Data
Can I have access to the WLC-R data? What else can I use the data for?
The yearly net zero trajectory data points for the built environment sub sectors are available for download here. The technical report contains the sources used for historic data, as well as the net zero trajectory projections. The yearly projections for the individual trajectory inputs are not published online but can be made available upon request. Please email ANZ@UKGBC.org with your specific request, with reference to the data input in the technical report.
UKGBC encourages and supports the industry in using the underlying Roadmap data to inform various outputs, as detailed below in the Pathway report:
Sub-Sector Roadmaps
The carbon trajectory provides an overarching carbon budget that can inform sub-sectors’ emission reduction plans and identification of interim targets. The Roadmap trajectory forms a consistent umbrella dataset, complementing detailed pathways for sub-sectors or industry stakeholder groups, ensuring a consistent sector approach while accounting for unique challenges and opportunities at a more granular level.
Asset Level Targets
The Roadmap carbon budget and sub-sector trajectories provide an invaluable resource to inform the development of standards and targets to underpin the definition of net zero carbon at an asset level, ensuring that targets are consistent with the sectoral net zero pathway
Workstreams
The Roadmap data can be used for domestic retrofit stock modelling of different house architypes to identify cost-optimal levels of fabric upgrades, as well as asset level net zero carbon standards and any verification scheme requirements
Is it possible to provide more detail on the baseline data and assumptions for the devolved regions?
At the moment, no. All data in the Roadmap is currently UK-wide, which means Scotland, Wales and Northern Island emissions are included within the overall trajectory. Some of the historic data within the Roadmap is split into regions, but we do not currently have granular enough data available to provide a regional split.
The Roadmap mentions that it ‘identifies sectoral average EUI trajectories for non-domestic buildings, derived from current aggregate energy usage data per sector?’ Can these be shared?
For sectors that cover a broader range of building types (e.g., education, healthcare), mapping specific EUI targets to the aggregate sectoral data that is in the Roadmap is more challenging. Asset level EUI research data is also more limited. For these sectors, the approach taken in the Roadmap was to display the standards for new buildings mapped over time as an improvement against the sectoral average for existing buildings. These pathways are not in a readily available format right now, and there is the caveat that they do not capture the differences in building types. However, UKGBC is committed to developing targets for a variety of sectors (see question below).
Further work on the Roadmap
Will UKGBC be developing embodied carbon and energy use intensity (EUI) targets for different sectors?
Developing asset-level net zero carbon compatible embodied carbon and operational energy targets for a variety of building sectors is a key priority for UKGBC in 2022. We are currently working with a number of prominent institutions and organisations to scope the methodology for deriving the targets, as well as the sectors that would be covered, seeking to align with existing classifications as much as possible and ensure compatibility with our national carbon budget and renewable energy availability. It is the intention that these targets are to be published in early 2023 as part of the collaborative industry project to deliver a standard for verifying built assets as net zero carbon. If you want to find out more, email ANZ@UKGBC.org.
For now, commercial offices are encouraged to use the Net Zero Performance Targets previously developed by UKGBC (available here).
When will the trajectory data be updated?
UKGBC is currently exploring options to provide regular updates on the built environment sector’s carbon footprint. We hope this can serve as an important accountability tool for the sector to track its progress over the next decade and beyond.
Conclusion
We hope that the Roadmap’s common vision for the UK built environment is one that can guide the sector in the next critical few decades. UKGBC is keen to support the industry in using the Roadmap, and that includes answering your questions. If you have any further questions, please send them in to ANZ@UKGBC.org.
Related
The Whole Life Carbon Roadmap – 4 Key Findings You Might Have Missed

What role do Landlords/Owners, Occupiers and Facilities Managers have to play in the transition to net zero?


Scaling climate change mitigation: Where do net zero buildings fit in?


3 key priorities for the UK built environment to help tackle the climate crisis

