In-Use Building Data Analysis Tool
Problem Addressed
Buildings never perform as efficiently in operation as their design intends. However, making sense of the vast amounts of operational data now available in most buildings to improve in-use energy and carbon performance is extremely challenging.
Engineers often have to navigate multiple disparate systems and data sources, encompassing different building and energy management systems, utility portals, IoT sensors and historic files. Typically, this has been a labour-intensive process, requiring multiple spreadsheets and significant manual effort to gather, organise, manage, and interrogate operational building data in a meaningful way. This fragmented approach has further limited opportunities for cross data set interrogation, meaning key operational improvements and savings opportunities may go undetected.
With increasing emphasis being placed on in-use performance optimisation, through reporting frameworks and certifications such as NABERS, teams need as complete and accurate a picture of their building data as possible. They also need tools to help ensure that systems have been set up and commissioned properly, to limit performance gap issues.
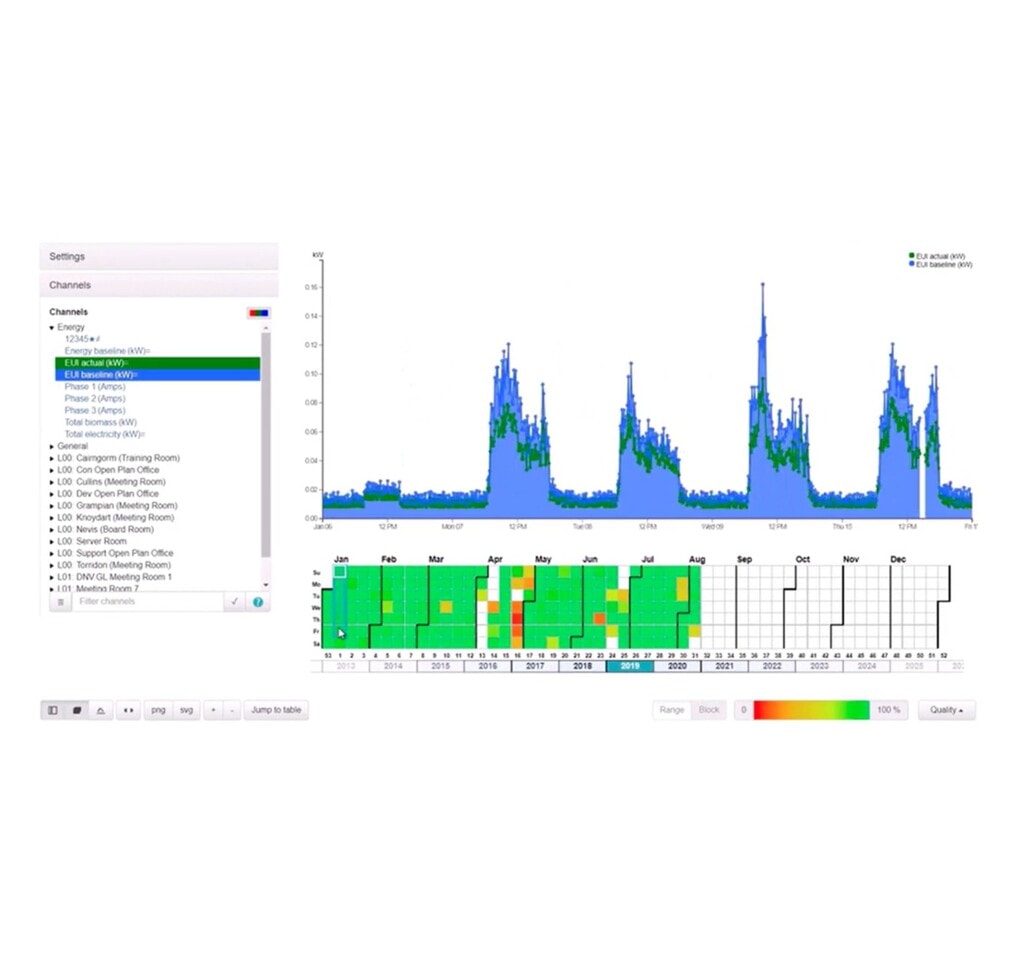
Finally, the utilisation of calibrated energy models to enable more reliable assessment of potential operational improvements or retrofit upgrades in existing buildings requires tools capable of generating accurate building energy demand profiles, based on real operational data. These are all areas in which iSCAN can support.
Case Study
iSCAN was used to facilitate data monitoring and analysis at Glasgow’s iconic Riverside Museum, after it was identified that the building was not performing optimally against other properties and energy management KPIs across the Glasgow Life portfolio.
IES set up a utility data (AMR) and building management system (BMS) data acquisition framework, and through the iSCAN platform were able to gather and analyse this data to provide visibility on major areas of energy use and track consumption trends across the museum, including any seasonal variations.
Initial investigation of the data brought to light a number of major consumers; one being the HVAC system which accounted for the majority of electrical energy consumption on site. The Air Handling Units (AHUs) serving the main exhibition space were a major factor in this, accounting for 36.5% of total electricity use, and the Chillers accounted for a further 10.8%. The Tall Ship, Glenlee, was also identified as an unexpected major consumer, drawing 10.8% of total electricity.
iSCAN enabled the museum to identify a series of energy saving interventions across the site, most of which were operational changes costing little or nothing to implement. Measures included rectifying inconsistencies in chiller operation, realigning set points, and fixing problems with the AHUs including unnecessary overnight operation.
Through this project, iSCAN delivered:
- 26% gas savings
- 18% electricity savings
- £53.2k cost savings (over the project year)
Through ongoing monitoring, it is expected that these savings will be retained year-on-year.
Facts and Figures
This page presents data, evidence, and solutions that are provided by our partners and members and should therefore not be attributed to UKGBC. While we showcase these solutions for inspiration, to build consensus, and create momentum for climate action, UKGBC does not offer commercial endorsement of individual solutions. If you would like to quote something from this page, or more information, please contact our Communications team at media@ukgbc.org.
Related members
Related
Building Optimisation Software Using AI and Digital Twins


BMS agnostic building optimisation


Energy Monitoring Platforms for Commercial Buildings


Cloud-based platform to bridge the performance gap between design and operation

