GIS Vulnerability Web Map
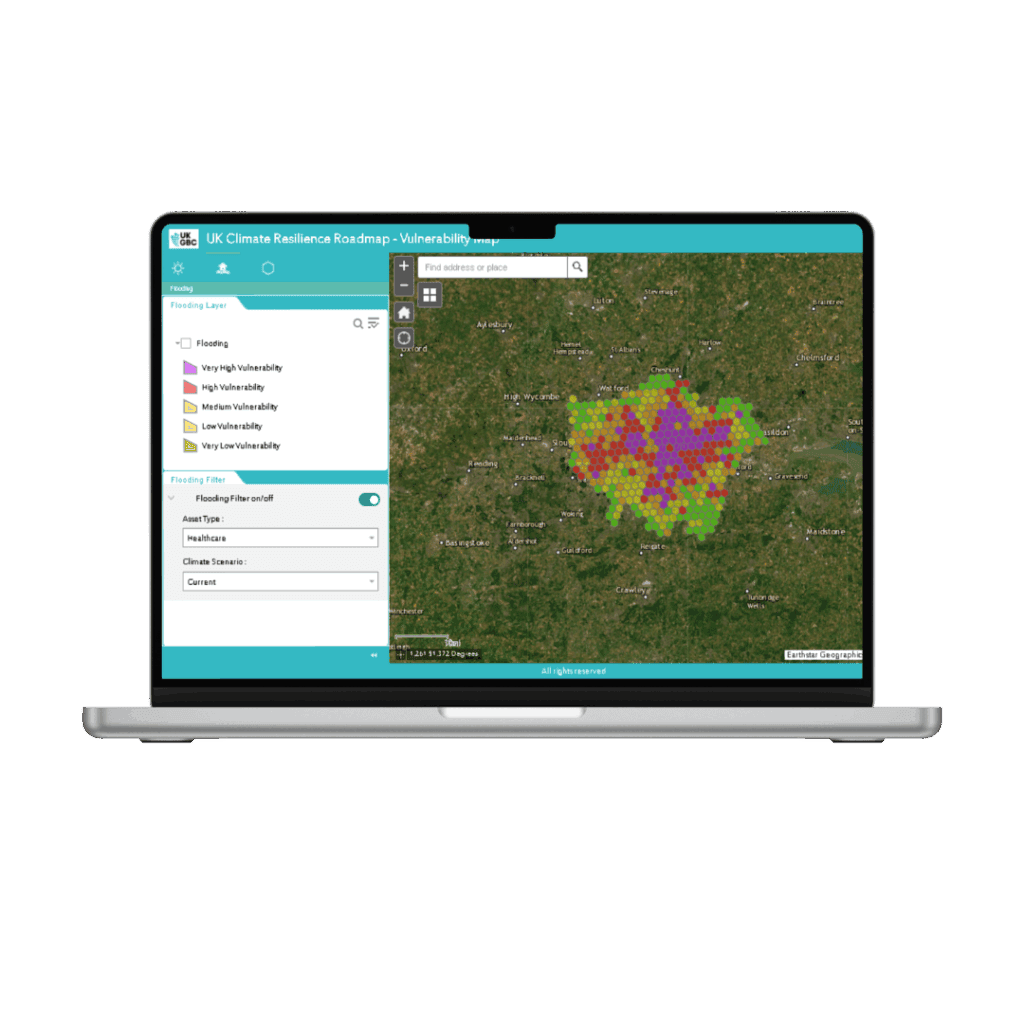
This Geographic Information System (GIS) map was created in collaboration with Equans as part of the UK Climate Resilience Roadmap. It illustrates the vulnerability of the built environment to overheating in London under climate warming scenarios.
The map helps to:
This vulnerability map integrates various factors, including vegetation, land use, building materials, and social vulnerability data, such as the Index of Multiple Deprivation (IMD), to identify areas more susceptible to climate hazards. The methods used to model these vulnerabilities are available in the UK Climate Resilience Roadmap Technical Report.
Interpreting the map
Understanding the Colour Coding
Each hexagon is coloured based on that area’s vulnerability. Colours indicate vulnerability levels:
- Very high vulnerability (purple)
- High vulnerability (red)
- Medium vulnerability (orange)
- Low vulnerability (yellow)
- Very low vulnerability (green)
*The information provided in this tool is approximate and indicative. It should not be used for planning, design, risk assessments, cost evaluation or decision-making purposes. We accept no liability for the accuracy of the information provided. We make no claims, no representations, and no warranties, express or implied, concerning the validity (express or implied), the reliability or the accuracy of the GIS data and GIS data product, including the implied validity of any uses of such data.
FAQs
The maps are designed for all built environment professionals and decision-makers across planning, design, development, asset management, and local government. This includes, but not limited to: urban planners, architects and design teams, developers and contractors, local authorities and policymakers, infrastructure and housing associations, sustainability and resilience consultants.
Vulnerability in the built environment is the susceptibility of built assets to climate-related risks. It is determined by physical, social, economic, and environmental factors or processes that increase the susceptibility of individuals, communities, assets, or systems to the impacts of hazards.
To systemically assess vulnerability, multiple datasets were integrated to act as a proxy for the three main components of vulnerability: exposure, sensitivity and adaptive capacity.
This generates a vulnerability index, which is crucial in understanding not only where or when people are most at risk from climate hazards like overheating, but also how badly they could be affected.
We look at three things:
- Exposure – The presence of people, buildings, infrastructure, or ecosystems in harm’s way.
- Sensitivity– How predisposed are people, buildings and infrastructure to being affected by climate hazards and their impacts?
- Adaptive capacity – How effectively are people, buildings, and infrastructure able to adapt to climate hazards and their impacts?
The final vulnerability index is a function of exposure, sensitivity and adaptive capacity. (in very simple terms Vulnerability = Exposure x Sensitivity x Adaptive Capacity).
For example, two buildings might face the same flood risk (same hazard and exposure), but if one is occupied by a low-income community with limited resources, its vulnerability is higher — and so the consequences of that risk are likely to be more severe.
While there are models available to project future storms and droughts, integrating them into spatial platforms for urban climate adaption is still an evolving process. We are currently working to expand this map to include vulnerability to flooding in cities across the UK. If you are interested in getting involved with this work, please reach out to our Resilience & Nature Team here.
London was chosen based on feasibility, data availability, and ability to test adaptation measures. While London provides a strong starting point, we aim to map more cities across the UK. Please get in touch with us to explore collaborating on this.
The data shared in the GIS map provides insights considering the different factors that play a key aspect of vulnerability. We relied on common data sources for each hazard modelling, which could present challenges to data granularity, availability, and scale. While it is not possible to look at a building level, the resolution offers a practical balance between neighbourhood relevance and processing capacity.
UK Climate Resilience Roadmap
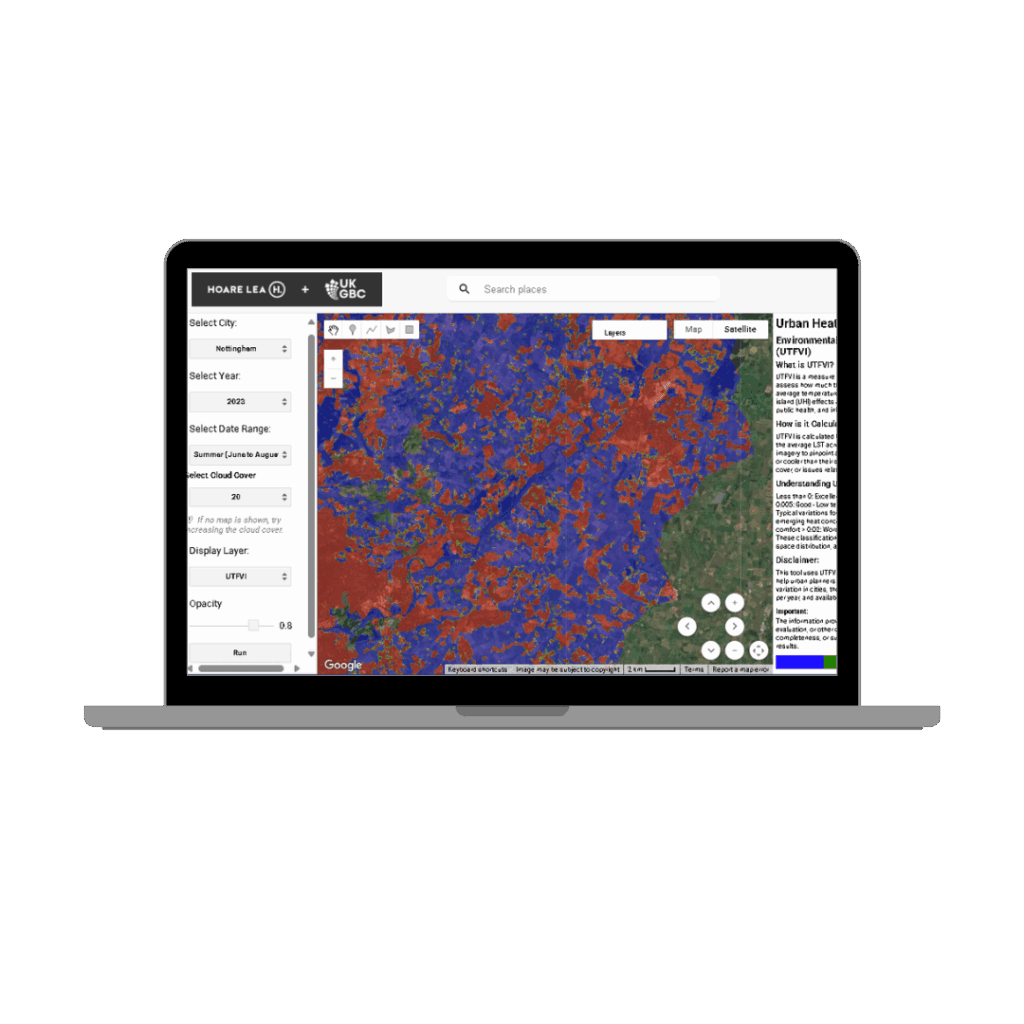
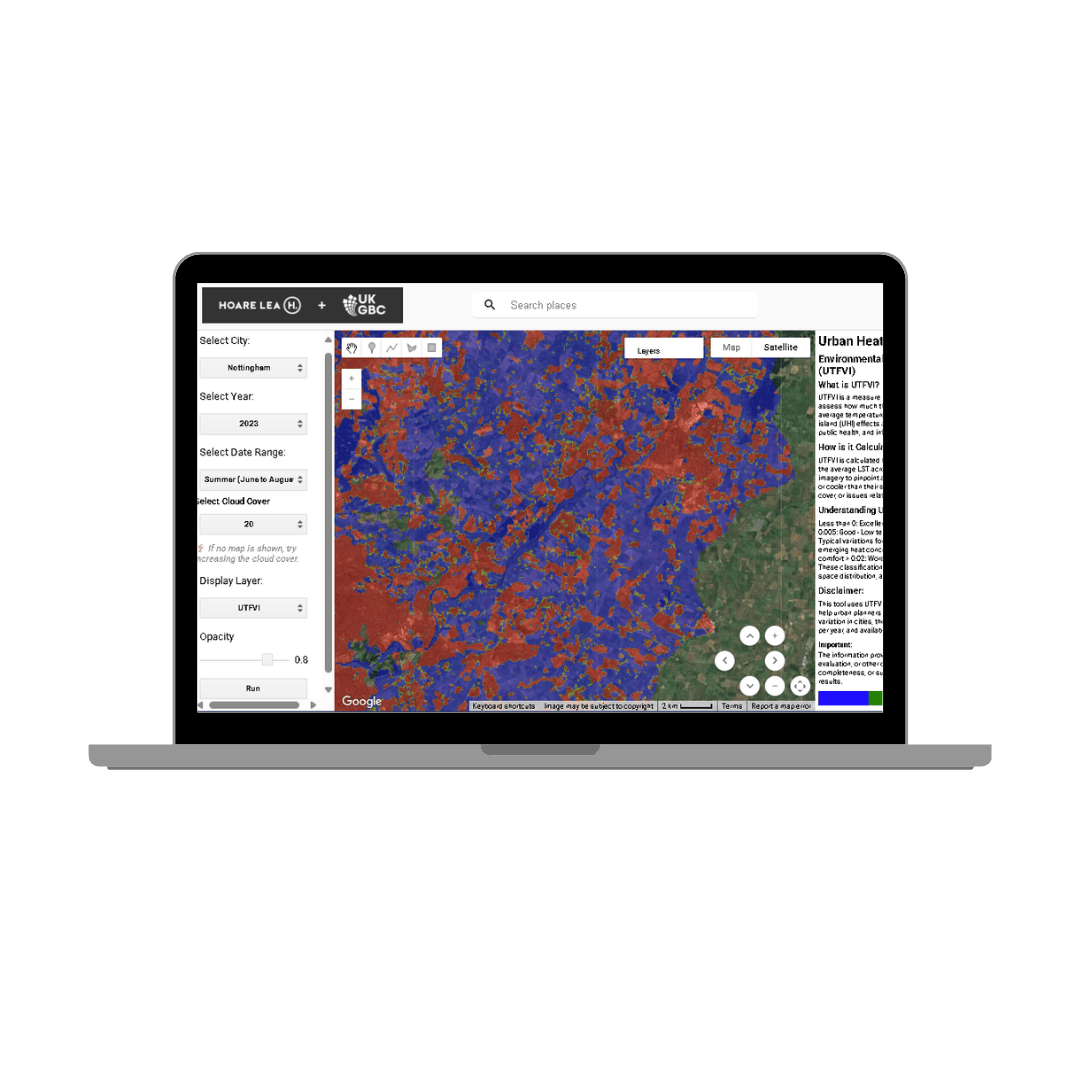
Urban Heat Island Webmap
UK Climate Resilience Roadmap Partners
With thanks to the following organisations for making this work possible:

Related
Urban Heat Island Web Map

Scaling Sustainable Solutions for the Built Environment: Barriers & Enablers


Whole Life Carbon Roadmap Progress Report 2025


Consultation Response: National Planning Policy Framework 2025

